For my master’s project I helped the Rehabilitation Counseling Department at Emporia State University create an entirely new, online Master’s degree. My roles were those of project manager and instructional designer. I followed the ADDIE method.
Here’s a marketing video for the project:
Analysis
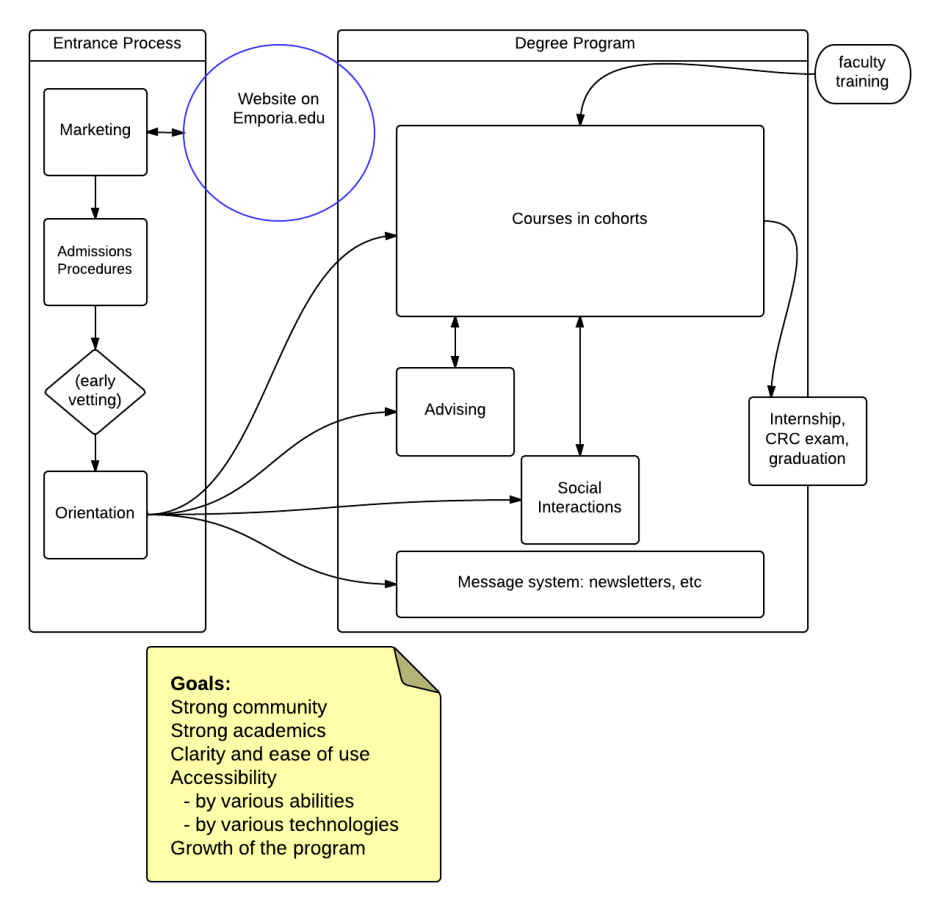
After meeting with the department and discovering their plans, preferences, and ideas, I created a flowchart of what they wanted the student experience through their program to look like. This served as a graphic representation of our objectives.
Then I created a project charter to define the scope, milestones, and deliverables for the degree.
It became clear that three specific deliverables were necessary to reach our goals, in addition to my continued role as a project manager:
- A faculty training course
- A student orientation to the program
- A student salon (to meet student socialization needs)
For the faculty training course, my analysis consisted of interviews with various faculty members, and a short interview in Survey Monkey.
For the student orientation, analysis consisted of reviewing program and department materials to determine what would be the most important information incoming students would need to know.
For the student salon, analysis consisted of meetings with the school’s IT professionals to determine what technology we had available to implement our objectives. We wanted a socialization tool that was easy to use; convenient; and, most importantly, securely private, since students might want to discuss some case details occasionally that needed to be kept absolutely confidential.
Design, Development, & Implementation
Faculty Training Course
Most of the faculty expressed that they had little experience with online teaching, and did not feel confident in their online course design and teaching skills. In addition, ESU was switching from BlackBoard to Canvas, and they did not feel confident in their abilities to use Canvas. Based on the information from the Analysis stage, and my knowledge of best practices in the field, I developed a training course for them. A tour of the training is shown below:
Student Orientation
I also created a student orientation for newly accepted students to the program. A tour of the student orientation is shown below:
Student Salon
To work toward the “social interactions” piece of the program goal, I built a virtual Student Salon. The tour of the Salon is shown below:
Evaluation
The follow-up evaluations happened in October and November, a few months after the launch of the new degree. I gathered both qualitative and quantitative data. Because they only had one student enroll in the first semester, I could not gather data on the student orientation and student salon.
One major, exciting indicator of success, though, was the fact that, mid-semester, the department was awarded a grant of almost $1 million, to provide scholarships to incoming students! I am thrilled for them, and honored to have been a part of this achievement!
Qualitative data collection
I interviewed faculty (through email and phone, whichever worked best for each person) to learn how the program is going, how my interventions helped them, and what could have been better. Overall, people were very pleased with what I had done. Some positive comments I received:
- Would it be possible to offer this CANVAS training link to all faculty? I think the training is spectacular.
- Kudos to you for getting the videos captioned. I am very grateful for that!
- I went on the training and was very impressed!
The main complaint was the perceived lack of in-person help during the training. Although I had made myself available by phone and email, and ESU had technical help channels, I did not communicate this clearly enough to the faculty; therefore, some of them felt isolated at times, and motivation was dampened.
Another problem was that some faculty did not complete the training entirely. Initial enthusiasm was good, but as time progressed, they logged in less and less.
I feel that both of these problems were related to the same issue: social presence online. I worked to build this sense in the training, but I could have done more. In the future if I do something like this again, I will schedule weekly virtual training sessions, so that people have something to put on their calendars, to hold them accountable. In these weekly sessions, everyone will log in from wherever they are, and go through the training at the same time. They will know that others are there, and they can ask questions in the chat room or by phone, as they arise. They can also share their progress with others who are logged in at the same time, increasing the sense of community.
Quantitative data collection
I logged in to several courses created by faculty after they had gone through my training. I used a rubric I created, based on the training topics, to evaluate course compliance with the training. The rubric is shown below. Overall, the courses achieved an average of 81.9% compliance.
